Visualizing Absenteeism in Congress
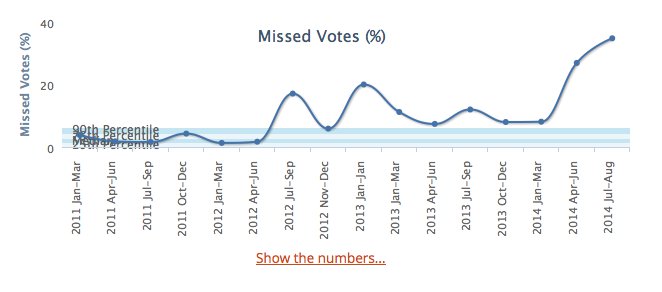
24 Aug 2014Since I left New Orleans, I’ve continued to watch Cedric Richmond’s absenteeism climb. I started wondering what the data on attendance looked like in the House and the Senate.
Collecting Data
I let my computer run last night pulling down all the vote data I could capture from 1989 to present day. I loaded it up into a large pandas DataFrame this morning (about 2 Gigs) and started splitting some data. The first thing I thought about was breaking the data up into states. I decided I would first aggregate the total votes for each state. Then I would aggregate the total Not Present votes for each state. Then I would divide those two state-indexed vectors to get the percentage of missed votes per state. That code looks something like this:
total_votes = senate_votes.state.value_counts()
not_voting = senate_votes[senate_votes.result == 'Not Voting'].state.value_counts()
senate_missed_percentages = not_voting / total_votes
The same calculation was performed on House data. The result field may have a few different values depending on the vote and on whether it’s the Senate or the House. The 4 primary values for a typical vote are:
- Present
- Not Voting
- Aye/Yea
- Nay/No
A vote of Present means the legislator is present for the vote, but is choosing to abstain from making a choice. Not Voting means the legislator is not present at all. Aye and Nay are self-explanatory. Aye/Yea and Nay/No are different conventions used in different procedures but mean the same thing.
Visualizatons
I knew I wanted to make an interactive choropleth map to show the data. I had hoped on modifying Mike Bostock’s d3 example but I was not patient enough to learn d3 and couldn’t get it to work. Instead I just used Leaflet and removed the map tiling.
Unfortunately, I could not figure out how to imitate Bostock’s nice projection (with Hawaii and Alaska in the frame) so you will need to scroll or zoom a bit to see them. The maps support pinching and dragging. The darker the value here the more missed votes. Hover over each state to see the true percentage.
Senate
The highest 3 states for the Senate are:
- MA (7.73%)
- NC (6.76%)
- AZ (6.26%)
The lowest 3 states are:
- ME (0.36%)
- WI (0.76%)
- MI (0.91%)
House
The highest 3 states for the House are:
- WY (12.31%)
- AK (12.10%)
- LA (6.74%)
The lowest 3 states are:
- DE (1.39%)
- ME (1.93%)
- NE (2.01%)
Thoughts
While this was fun and I plan to keep exploring the data, the results don’t necessarily tell a story on their own. It’s clear that some states’ legislators are not showing up to vote more than others, but it’s not clear what they are doing instead or whether or not they have a choice (perhaps committee duties interfering with votes?). I have to also consider that while I see missing votes as an unambiguously bad thing, many people in this country see disengaging in national politics as a point of pride.